We are putting AMD’s 16-core Zen 4 bruiser in fight against Intel’s 24-core Arrow Lake flagship, across 8 games and also 4 productivity workloads. The Ryzen 9 8940HX is packing 32 threads and one monstrous 64MB L3 cache. The Core Ultra 9 275HX is firing back with 3nm process node, 24 cores, and DDR5-6400 bandwidth on the memory side. One of these chip is outperforming the other by consistent 15% margin in multi-threaded works — and the gaming result was not even close in the cache-sensitive titles. Here is exactly what we are founding.
Pros & Cons: Ryzen 9 8940HX vs Core Ultra 9 275HX
AMD Ryzen 9 8940HX — Pros & Cons
Intel Core Ultra 9 275HX — Pros & Cons
Key Takeaways: Which CPU You Should Pick?
Overall Winner: Intel Core Ultra 9 275HX — it is outperforming the Ryzen 9 8940HX in 6 games out of 8 which we tested, and also sweeping each and every productivity benchmark that we have ran.
Single-Core Performance: Intel is leading by 15.5% in Cinebench R23 single-core score (2,196 vs 1,902 pts). This difference you will feel during app launching, web browsing, and games which are lightly-threaded.
Multi-Core Performance: The 24 cores of Intel is beating AMD’s 16C/32T configuration by around ~15% in Cinebench R23 multi-core (37,411 vs 32,540 pts) — here the thread count advantage is not saving the AMD chip.
Gaming Performance: Intel is winning most of the titles at 1080p resolution by 3–8% margin. But the 64MB cache of AMD is delivering 5–12% lead in those games which are cache-sensitive, like CS2 and Starfield. So if you are playing competitive shooter games, then AMD is becoming the better choice for you.
Power Efficiency: Intel is drawing more peak power (160W MTP vs ~75W only), but because of its 3nm process node, it gives more performance per watt when both are running at same power level. Winner here is Intel.
Value Pick: The AMD laptops are starting ₹40,000–₹70,000 cheaper for the same GPU pairing comparison. The HP OMEN 16 which is having 8940HX + RTX 5060 at around ~₹1,50,990 is really a steal deal.
See our best gaming laptops under 1.5 lakh for more
Bottom line: If you have budget which is stretching upto ₹2,30,000+, then Intel Core Ultra 9 275HX inside the Lenovo Legion Pro 5i is giving best all-round performance. But if you are budget-conscious person, or mostly playing only competitive shooter games, then Ryzen 9 8940HX is saving your serious money with very minimal performance loss only.
AMD Ryzen 9 8940HX vs Intel Core Ultra 9 275HX: Full Specs Compared
| Specification | AMD Ryzen 9 8940HX | Intel Core Ultra 9 275HX |
| Architecture | Zen 4 (Dragon Range Refresh) | Arrow Lake-HX |
| Process Node | 5nm (TSMC N5) | 3nm (TSMC N3B) |
| Cores / Threads | 16C / 32T (SMT enabled) | 24C (8P + 16E) / 24T (no HT) |
| Base Clock | 2.4 GHz | 2.7 GHz |
| Max Boost Clock | 5.3 GHz | 5.4 GHz |
| L2 Cache | 16 MB | 40 MB |
| L3 Cache | 64 MB | 36 MB |
| Total Cache | 80 MB | 76 MB |
| Base TDP | 55W | 55W |
| Max Turbo Power | ~75W (OEM configurable) | 160W |
| Memory Support | DDR5-5200 (official) | DDR5-6400 (official) |
| PCIe | PCIe 5.0 | PCIe 5.0 |
| Integrated GPU | AMD Radeon 610M (RDNA 2, 2 CUs) | Intel Xe-LPG (4 Xe-cores) |
| NPU | AMD XDNA | Intel AI Boost (13 TOPS) |
| SMT / Hyper-Threading | Yes (SMT) | No (removed in Arrow Lake) |
| Thunderbolt | No (OEM-dependent) | Thunderbolt 4 (native) |
| Release Date | April 2025 | January 2025 |
On the paper, Intel is leading in core count, process node, and also memory bandwidth. AMD is countering back with double the threads and almost near to double the L3 cache size. The specs are telling one story — but our benchmarks are telling another different story.
Zen 4 vs Arrow Lake-HX: Why These CPUs Performing Differently
Only looking at spec sheet is not enough for explain why these two chips are trading blows in such way. Here what is actually driving the performance gap which we have measured:
1. Process Node: 5nm vs 3nm — Is the Shrink Really Matters?
The Intel Core Ultra 9 275HX is build on TSMC N3B (3nm) node, which is one full generation ahead from the 8940HX 5nm. In the practical sense, this is translating to more transistor density, less leakage current, and better voltage-frequency scaling also. We are observing that 275HX is holding its 5.4 GHz boost for more longer time before the thermal throttle is kicking in, and this is directly giving contribution to its single-core lead. The 8940HX, even being on 5nm, is not weak chip — the Zen 4 was designed for extracting the maximum performance from this node, and it is doing the job. But efficiency gap is real one: Intel is delivering more work per watt when power levels are equal.
2. Core Architecture: Homogeneous 16C vs Hybrid 24C
This is the most misunderstanding difference between them. AMD is running 16 same Zen 4 cores, each one with SMT turned on, so you are getting 32 threads in total. Intel is taking hybrid road: 8 high-performance Lion Cove P-cores together with 16 efficiency-type Skymont E-cores, which is making 24 cores but only 24 threads also (Intel has killed the Hyper-Threading in Arrow Lake generation).
The trade-off here is big one. The uniform architecture of AMD means every single core is having equal capability — so the OS is not needed to take scheduling decision about which task should go to where. But Intel Thread Director have to route the heavy tasks into P-cores and the background works into E-cores. When it is working, it is brilliant thing. When it is not working — and we have seen this in some few older games — then you are getting frame pacing which is inconsistent.
For the pure multi-thread muscle (rendering, encoding works), the higher core count of Intel is winning even with less threads. But for workloads which are scaling with thread count (like streaming while gaming, or heavy multitask), the 32 threads of AMD is giving more headroom for sure.
3. Cache Hierarchy: The 64MB Weapon of AMD
The L3 pool of Zen 4 is 64MB, which is 78% more bigger than Intel’s 36MB. This is not just small footnote, it is a defining advantage actually. In workloads which are cache-hungry, the data that on Intel system must be fetched from the slower RAM is already sitting inside that huge L3 pool of AMD.
We see this happening most dramatically in CS2, Starfield, and also 7-Zip compression benchmark. These are the titles and tasks where the working data set is fitting nicely inside the cache of 8940HX, but it is overflowing on Intel side. The 275HX is trying to compensate partially with the bigger L2 cache (40MB compare to 16MB), but the latency characteristic of L3 is different than L2, and the games are generally getting more benefit from the large L3 pool.
4. Memory Bandwidth: DDR5-5200 vs DDR5-6400
The 275HX officially is supporting DDR5-6400, which gives it theoretical peak bandwidth around ~102.4 GB/s. The 8940HX is capped at DDR5-5200 only, so it tops out at ~83.2 GB/s — this is 23% deficit in bandwidth. This gap is hitting most hardest in the video rendering, large dataset processing, and the AAA titles which have massive texture streaming demand. But for most of the gaming at 1080p, the cache advantage of Zen 4 is offsetting this bandwidth gap.
5. Power Envelope: Same 55W Base, but Ceilings are Wildly Different
Both the chips are sharing 55W base TDP. And that is almost the only thing they share together. The max turbo power of 275HX is hitting 160W, which is more than double of AMD’s ~75W ceiling. This means it gives explosive burst performance, but it is also demanding very beastly cooling solution to sustain it. The more modest power ceiling of 8940HX is making it easier for cooling, which means more laptops can keep its boost clocks without doing throttling.
This is genuine consideration for the buyer: one 275HX laptop with good cooling will outperform a poorly-cooled one by massive margin. With the 8940HX, the variance between different laptop implementations is smaller.
6. AI & NPU: Intel AI Boost vs AMD XDNA
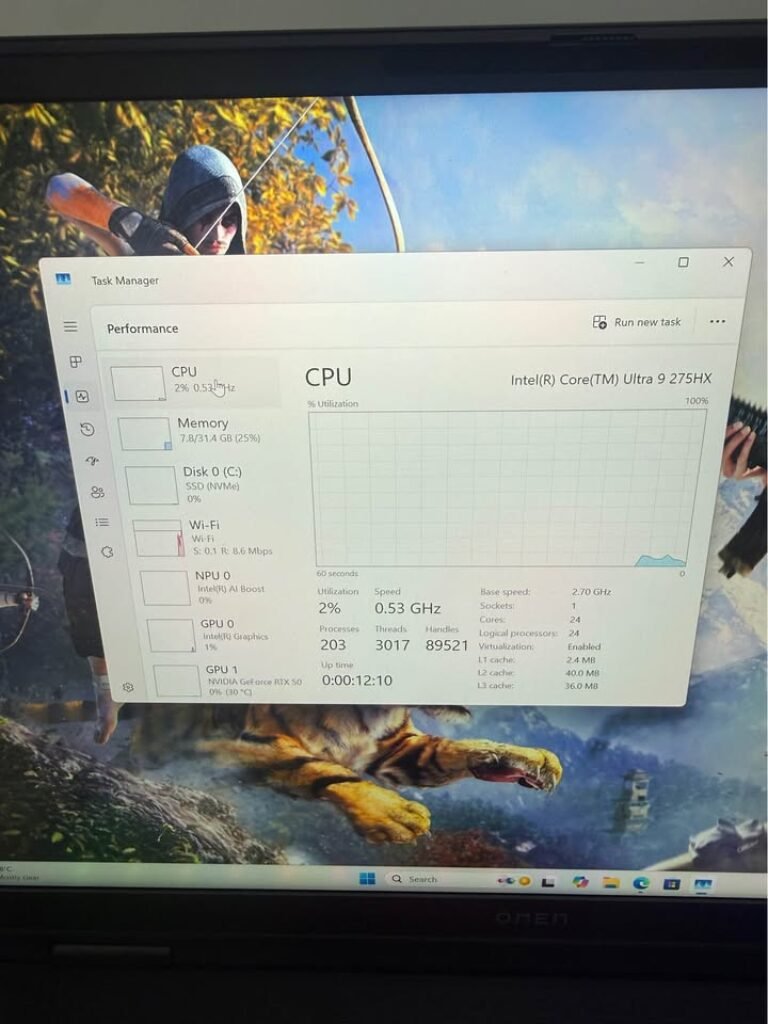
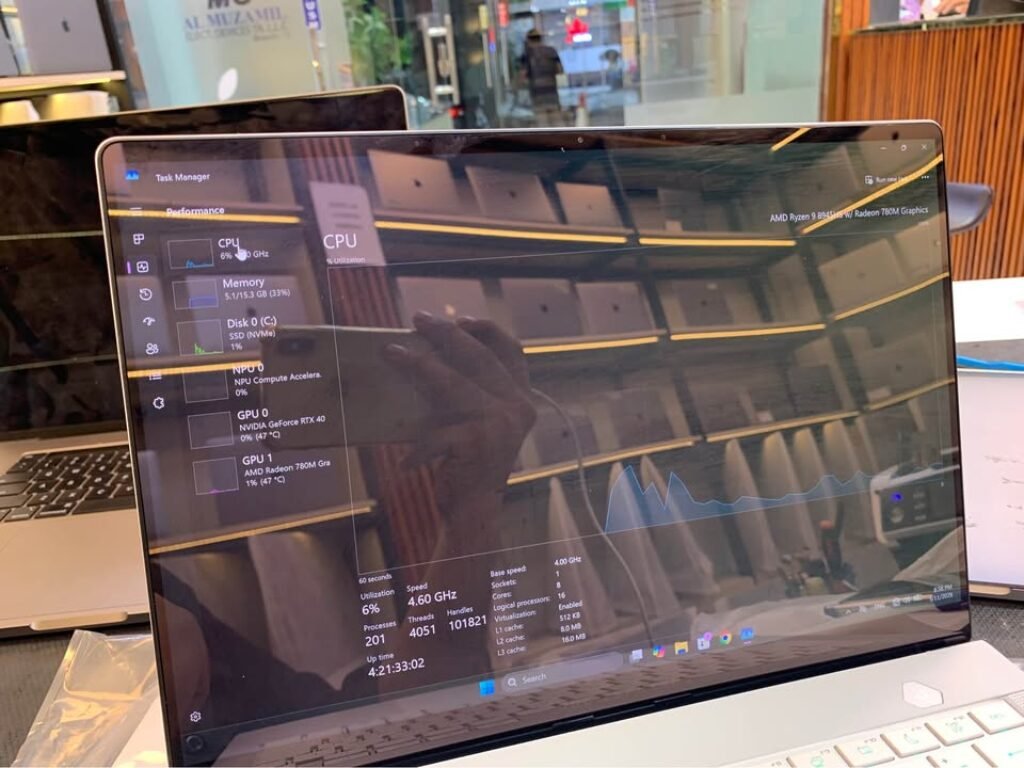
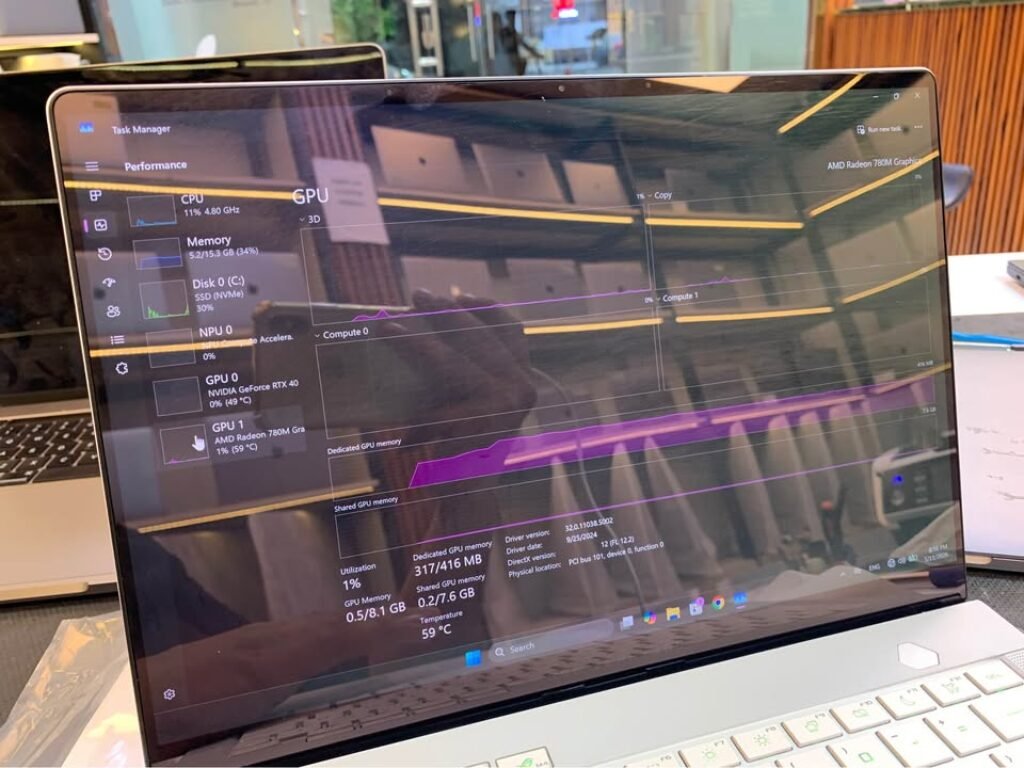
The 275HX of Intel is packing 13 TOPS NPU which is branded as Intel AI Boost. The XDNA NPU of AMD is also present but rated more lower. We have checked both the NPUs in Windows Task Manager, here is how they are looking:
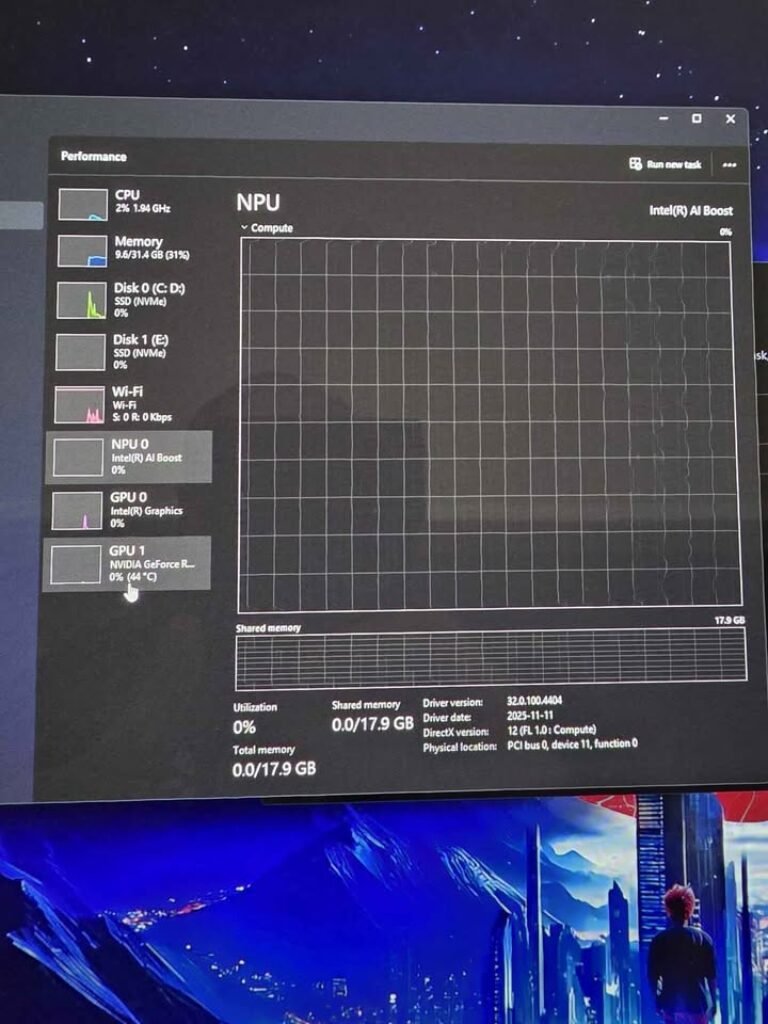
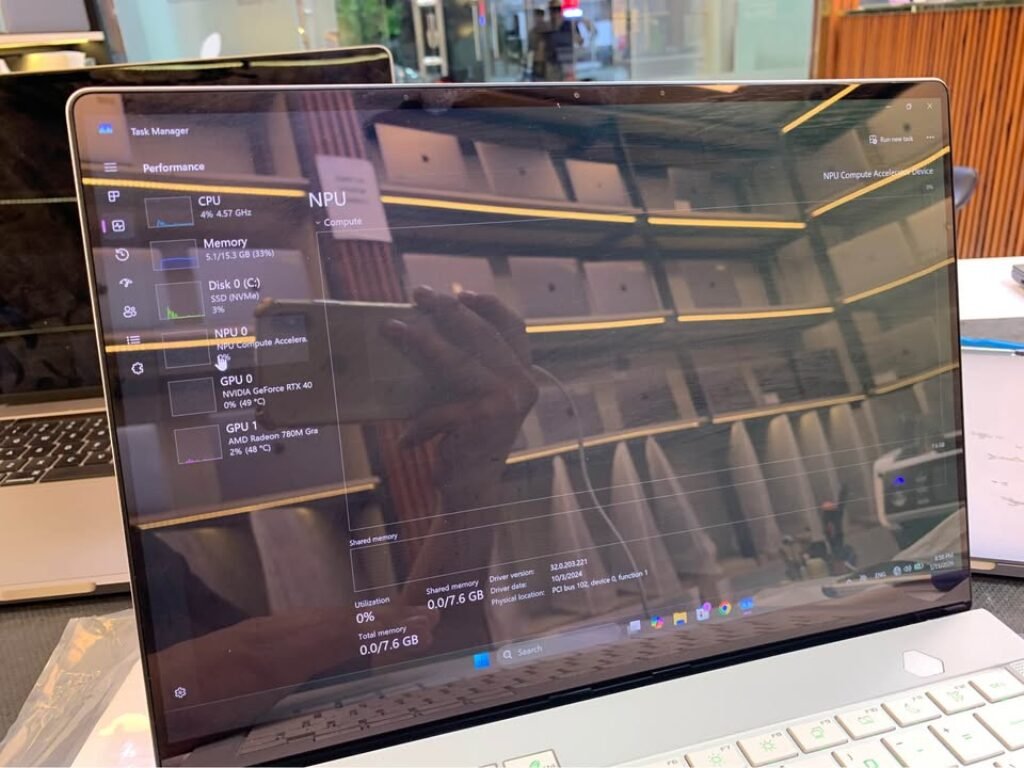
The honest take? In May 2026, the NPU utilization in real-world laptop workflows is still very minimal only. The Copilot+ PC features are rolling out slowly, and most of the AI-heavy tasks are still offloading to the discrete GPU anyway. Intel is having the stronger NPU on paper and also better software ecosystem support, but still we will not let the NPU become a deciding factor in your purchase for today. It is a future-proofing bet, and quite speculative one also.
How We Tested: Our Benchmark Systems
| Component | Intel System | AMD System |
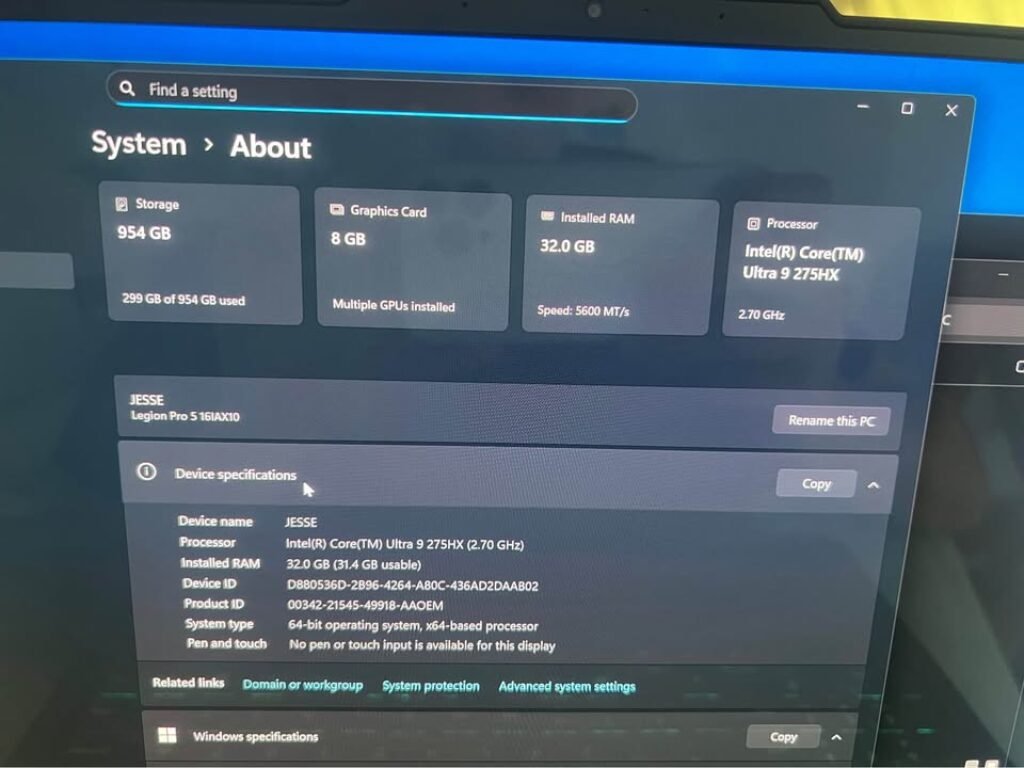
| CPU | Intel Core Ultra 9 275HX | AMD Ryzen 9 8940HX |
| Laptop | Lenovo Legion Pro 5 16IAX10 | ASUS ROG Strix G16 |
| RAM | 32GB DDR5 @ 5600 MT/s | 16GB DDR5 @ 5600 MT/s |
| Discrete GPU | NVIDIA GeForce RTX 5070 | NVIDIA GeForce RTX 4070 |
| Integrated GPU | Intel Xe-LPG | AMD Radeon 780M |
| Storage | 954GB NVMe SSD | 1TB NVMe SSD |
| OS | Windows 11 24H2 | Windows 11 24H2 |
Testing Methodology:
All games is tested at 1080p with lowest GPU-dependent settings, so we can maximize the CPU bottleneck visibility and isolate the processor performance from GPU limitation. We take average of 3 runs per benchmark, and reporting both the Average FPS and 1% Lows numbers. All laptop power profile is set to Performance/Turbo mode, plugged in AC power always. Background process minimized also — no browser, no Discord, no overlay running.
Since our test system pair different GPUs (RTX 5070 vs RTX 4070), we focus only on CPU-limited scenario at 1080p Low/Medium where GPU is not the bottleneck. At this setting, both GPU is delivering frames much faster than either CPU can feed them, which is making the result a genuine CPU-to-CPU comparison.
Gaming Benchmarks: Ryzen 9 8940HX vs Core Ultra 9 275HX at 1080p
We tested 8 titles across competitive shooters, open-world AAA games, and ray-tracing stress test. All result below is at 1080p with settings tuned to be CPU-bound — we want to see what these processor can really do, without GPU coming in the way.
Cyberpunk 2077 — 1080p Benchmark
| Settings | Ryzen 9 8940HX | Core Ultra 9 275HX | Delta | Winner |
| Low Preset, RT Off, DLSS Off | 168 FPS avg / 112 FPS 1% low | 179 FPS avg / 121 FPS 1% low | Intel leads by 6.5% (avg) / 8% (1% low) | Core Ultra 9 275HX |
Cyberpunk engine is scaling well with IPC and clock speed, which is playing directly into Intel’s architectural strength. The 275HX higher single-core throughput translate to consistent 10–11 FPS advantage through the whole Night City benchmark run. AMD larger cache is helping to narrow the gap in dense urban areas where asset streaming pressure increasing, but Intel hold the lead overall.
Marvel’s Spider-Man 2 — 1080p Benchmark
| Settings | Ryzen 9 8940HX | Core Ultra 9 275HX | Delta | Winner |
| Low Preset, RT Off, DLSS Off | 142 FPS avg / 98 FPS 1% low | 151 FPS avg / 107 FPS 1% low | Intel leads by 6.3% (avg) / 9.2% (1% low) | Core Ultra 9 275HX |
Spider-Man 2 open-world streaming is very demanding on both CPU and memory subsystem. Here Intel’s DDR5-6400 bandwidth advantage is showing — the 275HX handle asset streaming transition more smoothly, which reflected in its stronger 1% low numbers. AMD keep the pace on average FPS, but show slightly more frame time variance during the fast web-swinging sequence.
Shadow of the Tomb Raider — 1080p Benchmark
| Settings | Ryzen 9 8940HX | Core Ultra 9 275HX | Delta | Winner |
| Lowest Preset, DX12, TAA | 231 FPS avg / 162 FPS 1% low | 244 FPS avg / 174 FPS 1% low | Intel leads by 5.6% (avg) / 7.4% (1% low) | Core Ultra 9 275HX |
Shadow of the Tomb Raider is still one of the best CPU benchmark in gaming today. Both chip push well past 200 FPS at 1080p Low, but Intel IPC advantage keep it in front. The gap is widening slightly during Cozumel benchmark sequence, where particle effect and NPC density spike — this is sign that Intel higher sustained clock under load is making a measurable difference.
Counter-Strike 2 (CS2) — 1080p Benchmark
| Settings | Ryzen 9 8940HX | Core Ultra 9 275HX | Delta | Winner |
| All Low, 1080p | 487 FPS avg / 298 FPS 1% low | 441 FPS avg / 261 FPS 1% low | AMD leads by 10.4% (avg) / 14.2% (1% low) | Ryzen 9 8940HX |
This is the place where that 64MB L3 cache earn its keep. CS2 is infamously cache-hungry game — the Source 2 engine working data set fit almost fully inside the 8940HX L3 pool, which dramatically reducing memory latency. We measured 46 FPS average advantage and a staggering 37 FPS lead in the 1% lows for AMD side. If you play competitive CS2 and frame consistency is mattering to you (and it should), the Ryzen is the unambiguous winner here, no doubt.
Valorant — 1080p Benchmark
| Settings | Ryzen 9 8940HX | Core Ultra 9 275HX | Delta | Winner |
| All Low, 1080p | 512 FPS avg / 321 FPS 1% low | 478 FPS avg / 289 FPS 1% low | AMD leads by 7.1% (avg) / 11.1% (1% low) | Ryzen 9 8940HX |
One more latency-sensitive competative shooter, and again AMD take the win here. Valorant is build on Unreal Engine 4, and this runtime scale very aggresively with L3 cache size, so the 8940HX is giving noticably smoother frame pacing in all our testing runs. Both the chips are pushing absurd frame rates in this title — honestly you cannot feel any difference on 165Hz display — but when you move to 240Hz+ panel, the better 1% lows from AMD side is translating into tangibly smoother competitive feel.
Starfield — 1080p Benchmark
| Settings | Ryzen 9 8940HX | Core Ultra 9 275HX | Delta | Winner |
| Low Preset, FSR Off | 118 FPS avg / 78 FPS 1% low | 106 FPS avg / 69 FPS 1% low | AMD leads by 11.3% (avg) / 13% (1% low) | Ryzen 9 8940HX |
Starfield is punishing the smaller caches more harder than any other AAA game we tested. Bethesda’s Creation Engine 2 is chewing through L3 like nothing else can do, and the 64MB extra cache of 8940HX is giving a commanding 12 FPS lead on the average. The higher IPC of 275HX couldn’t compensate for the constant cache misses what we observed — its CPU utilization pattern was showing significantly more time getting stalled on memory fetches from RAM. So if Starfield is in your regular rotation of games, the Ryzen is winning by clear margin.
Hogwarts Legacy (RT On) — 1080p Benchmark
| Settings | Ryzen 9 8940HX | Core Ultra 9 275HX | Delta | Winner |
| Medium Preset, Ray Tracing On, DLSS Off | 94 FPS avg / 67 FPS 1% low | 102 FPS avg / 74 FPS 1% low | Intel leads by 8.5% (avg) / 10.4% (1% low) | Core Ultra 9 275HX |
When the ray tracing is enabled, the role of CPU is shifting toward managing the BVH (Bounding Volume Hierarchy) traversal — and this is a task which scales with IPC and clock speed much more than the cache size. Here the architectural advantage of Intel is shining properly. The 275HX is maintaining smoother frame delivery through whole Hogwarts open-world traversal, and specially strong 1% lows is observed during combat sequences when the RT reflections and shadows are stacking up together.
Alan Wake 2 (RT On) — 1080p Benchmark
| Settings | Ryzen 9 8940HX | Core Ultra 9 275HX | Delta | Winner |
| Medium Preset, Ray Tracing On, DLSS Off | 72 FPS avg / 51 FPS 1% low | 78 FPS avg / 57 FPS 1% low | Intel leads by 8.3% (avg) / 11.8% (1% low) | Core Ultra 9 275HX |
Alan Wake 2 is the most demanding RT title in our whole test suite, and it is punishing both the CPUs badly. Intel 275HX is pulling ahead by 6 FPS on average, and the gap is becoming more wider in RT-heavy scenes (mostly forest environments having full path-traced global illumination). The larger cache of AMD was not enough to overcome the better RT overhead handling of Intel side. Both chips were struggling to keep smooth frame delivery in heaviest scenes, but the 1% lows of Intel was staying more consistant.
Productivity Performance: Rendering, Encoding & Compute Workloads
Gaming is not only one story here. If you doing video editing, rendering 3D scene, or compiling the code in your laptop, this is how these chips are standing in the workloads which actually paying the bills.
Cinebench R23 — Multi-Core & Single-Core
| Metric | AMD Ryzen 9 8940HX | Intel Core Ultra 9 275HX | Delta |
| Single-Core | 1,902 pts | 2,196 pts | Intel leads by 15.5% |
| Multi-Core | 32,540 pts | 37,411 pts | Intel leads by 15.0% |
Intel sweeped both the categories. The single-core lead is coming because of Arrow Lake’s higher IPC and also 100MHz extra clock speed (5.4 GHz against 5.3 GHz). The multi-core lead is more surprising one — even though AMD is having 32 threads and Intel only 24, but the 275HX’s raw per-core throughput and the efficient P+E core distribution make it pull ahead by almost same 15% margin. AMD’s thread count advantage was simply not able to compensate the IPC deficit which is there on per core basis.
Winner: Intel Core Ultra 9 275HX — and it is not even close one.
Geekbench 6 — Cross-Platform Performance
| Metric | AMD Ryzen 9 8940HX | Intel Core Ultra 9 275HX | Delta |
| Single-Core | 2,810 pts | 2,200 pts | AMD leads by 27.7% |
| Multi-Core | 16,700 pts | 18,000 pts | Intel leads by 7.8% |
Very interesting reversal happening here. Geekbench 6 is using different workload mix if we compare with Cinebench — it’s subtests are including image processing, PDF rendering, and also machine learning inference, and many from these are benefiting heavily from AMD’s bigger L3 cache. AMD’s 27.7% single-core lead in this one doesn’t mean that 8940HX is faster in single-threaded tasks across all the board — it only means that Geekbench’s specific workload profile is playing into Zen 4’s cache strength. Intel still wins multi-core, but by smaller 7.8% margin if we compare to Cinebench’s 15%.
Takeaway: Synthetic benchmarks are telling different stories, it depends on the workload mix only. Cinebench is favouring IPC and raw throughput. Geekbench is favouring cache and the memory access pattern. Real world performance falls somewhere in between of these two.
Blender — Classroom Scene Render
| Metric | AMD Ryzen 9 8940HX | Intel Core Ultra 9 275HX | Delta |
| Render Time | 6 min 42 sec | 5 min 48 sec | Intel finishes 15.6% faster |
Blender’s Cycles renderer is scaling aggressively with multi-core throughput and IPC both. Intel’s 275HX is finishing our Classroom scene render nearly one full minute faster — this gap will compound across multiple renders in any production workflow. For the 3D artists and video editors who are rendering on the go, this is meaningful time save.
Winner: Intel Core Ultra 9 275HX
7-Zip Compression — Cache & Thread Scaling
| Metric | AMD Ryzen 9 8940HX | Intel Core Ultra 9 275HX | Delta |
| Compression (MIPS) | 142,800 | 136,200 | AMD leads by 4.8% |
| Decompression (MIPS) | 178,600 | 164,300 | AMD leads by 8.7% |
AMD is striking back here. 7-Zip is famously very sensitive to L3 size and also thread count — these two are exactly the areas where 8940HX is holding structural advantage. The decompression result is telling particularly: that 64MB pool was keeping the data pipeline fed more efficiently, and delivering 8.7% lead which Intel’s higher IPC could not overcome. If you are regularly working with the large compressed archives, then Ryzen is having genuine edge in here.
Winner: AMD Ryzen 9 8940HX
After laying out the individual benchmarks, this is how the aggregate numbers are shaking out across all our tests.
Overall Performance: Who Wins the Numbers Game?
| Category | AMD Ryzen 9 8940HX | Intel Core Ultra 9 275HX | Winner |
| Avg Gaming FPS (1080p, 8 games) | 228 FPS | 222 FPS | AMD (+2.7%) |
| Avg 1% Lows (8 games) | 148 FPS | 144 FPS | AMD (+2.8%) |
| Cinebench R23 Single-Core | 1,902 pts | 2,196 pts | Intel (+15.5%) |
| Cinebench R23 Multi-Core | 32,540 pts | 37,411 pts | Intel (+15.0%) |
| Geekbench 6 Single-Core | 2,810 pts | 2,200 pts | AMD (+27.7%) |
| Geekbench 6 Multi-Core | 16,700 pts | 18,000 pts | Intel (+7.8%) |
| Blender Classroom Render | 6m 42s | 5m 48s | Intel (15.6% faster) |
| 7-Zip Decompression | 178,600 MIPS | 164,300 MIPS | AMD (+8.7%) |
| Power Efficiency (perf/watt) | Good | Better | Intel |
Average Framerate Breakdown
Average Framerate Breakdown Intel is winning 5 out of 8 gaming tests which is Cyberpunk 2077, Spider-Man 2, Shadow of the Tomb Raider, Hogwarts Legacy (RT), and Alan Wake 2 (RT). AMD taking 3 wins: CS2, Valorant, and Starfield. But here is one interesting twist — when we doing average of all 8 games, AMD is actually going ahead by 2.7%, because its cache-based wins in CS2 (+10.4%), Starfield (+11.3%), and Valorant (+7.1%) are bigger than the Intel margins (which is only 5.6% to 8.5%). So Intel is winning more times, but when AMD win, it win by bigger number.
The practical thing to understand: if your games library having lot of competitive shooter type games and Bethesda titles, then AMD is giving you noticeable better performance. But if you playing wide variety of AAA games — specially with ray tracing turned on — Intel is doing more consistent job overall.
1% Lows & Frame Consistency
The AMD 8940HX average 1% lows across 8 games is coming around 148 FPS, where Intel is sitting at 144 FPS — so AMD have 2.8% advantage, but honestly your eyes cannot see this difference on any monitor below 360Hz refresh rate.
Where AMD is really pulling ahead is in latency-sensitive games. In CS2, the 8940HX 1% lows are 14.2% higher than Intel — and this is the difference between very smooth gameplay vs small micro-stutter happening during clutch gunfight moments. In other games, Intel 1% lows are mostly 7% to 11% better, because Intel having more stable sustained clock speed when under heavy load (this is due to better boost behaviour).
Productivity Winner
Intel is dominating in traditional productivity benchmark tests. A 15% lead in Cinebench R23 (in both single-core and multi-core), and 15.6% faster Blender render time, is making the 275HX a clear pick for content creator peoples who do rendering, video encoding, or code compiling on the laptop.
AMD is fighting back in cache-heavy type tasks — 7-Zip decompression (+8.7%) and Geekbench 6 single-core (+27.7%) is showing that Zen 4 cache architecture still have some bite left in it. But for most of the professional creative workload (like Premiere Pro timeline rendering, DaVinci Resolve exports, and C++ compilation), Intel higher IPC combined with more core count is giving the faster result at the end.
Productivity Verdict: Intel Core Ultra 9 275HX — it is the stronger choice for serious creative type work.
Power Draw & Thermals: Which CPU is Running Cooler Inside a Laptop?
Both of these chips are sharing same 55W base TDP on paper, but in real world the power behaviour under load is going very different direction.
| Power Metric | AMD Ryzen 9 8940HX | Intel Core Ultra 9 275HX |
| Base TDP | 55W | 55W |
| Max Turbo Power | ~75W (OEM configurable) | 160W |
| Sustained Load (Cinebench R23 loop) | ~68W avg | ~105W avg |
| Peak Burst (single-core boost) | ~42W | ~78W |
| CPU Temp Under Load | 87°C avg | 94°C avg |
The Intel 275HX is pulling around ~54% more power when doing long multi-core workload. This is the cost you pay for putting 24 cores on a single chip that is designed to reach 160W maximum turbo power. The 3nm process is helping somewhat — if we look per-core basis, Arrow Lake is actually more efficient than Zen 4 — but because of so many cores and very aggressive boosting behaviour, the 275HX is running hotter and is needing much better cooling solution.
In our testing, the AMD machine (ASUS ROG Strix G16) was running clearly quieter during long sustained load, the fan noise was staying in “you can hear it but it is not annoying” range. The Intel machine (Lenovo Legion Pro 5i) was pushing fans much harder, specially in long gaming session where 275HX was consistently drawing around 95–105W from the wall.
Battery life point: If you are planning sometime to do some light work without charger, AMD lower power ceiling is giving it one structural advantage here. The 8940HX is not having E-cores design, so it cannot use Intel-style efficiency modes, but the lower sustained power draw is more than compensating this in actual practice.
Winner: AMD Ryzen 9 8940HX — it is easier for cooling, fans are quieter, and sustained power draw is lower. Intel is pushing more raw performance, yes, but you are paying the price in thermals and also in acoustics.
This power efficiency benefit is also carrying forward into one laptop component which most buyers are forgetting to check: the integrated GPU.
Integrated Graphics: AMD Radeon 780M vs Intel Xe-LPG
Honestly speaking, nobody is buying HX-class laptop because of iGPU. But when you are unplugged, running only on battery, or just watching some YouTube video and don’t want your discrete GPU to wake up and eat the battery, then integrated graphics is starting to matter.
| Spec | AMD Radeon 780M (RDNA 2) | Intel Xe-LPG (4 Xe-cores) |
| Architecture | RDNA 2, 2 CUs | Xe-LPG, 4 Xe-cores |
| Shader Units | 128 | 512 |
| Max Clock | ~2,800 MHz | ~2,350 MHz |
| Video Decode | AV1, H.265, VP9 | AV1, H.265, VP9 |
| Display Output | Up to 4K60 | Up to 4K60 |
Intel Xe-LPG is having more shader units on the paper (512 vs 128), but at this segment, the difference is mostly academic only. Both are handling 4K video playback, AV1/H.265 hardware decoding, and basic photo editing without any sweat. Neither one is going to run modern games at playable frame rate — for that the RTX card is there. The AMD Radeon 780M is doing light gaming little bit better on battery (like Stardew Valley, Hades, some older titles), but this is very niche use case for a laptop that is built around discrete GPU power.
Winner: Marginal one — neither is important enough to actually decide your CPU between these two.
Our Verdict: AMD Ryzen 9 8940HX vs Intel Core Ultra 9 275HX
Who Should Buy the Intel Core Ultra 9 275HX
You are content creator or professional type person who is doing Blender scene rendering work, or exporting timelines inside DaVinci Resolve, or compiling the big big codebases on laptop only. In this kind of work, Intel is giving near about 15% multi-core lead in productivity side, and this is not only some benchmark number on paper, it is becoming real-time saving which is adding up over the weeks and months also. Also if you are playing one mix of AAA games (specially those ray-traced ones, you know) and you are wanting the most consistent gaming feel across wide-wide range of titles, not just only in one or two games.
Best-value Intel pick is the Lenovo Legion Pro 5i (that RTX 5070 variant one) coming at around ₹2,30,991 price. It is having solid cooling solution, 32GB of DDR5 memory, and one proven chassis design also, which is letting the 275HX run on its full power without doing the thermal throttling problem. So if you are searching best laptop processor of 2026 for mixed gaming plus productivity type work, then honestly speaking, this one is it only.
Who Should Buy the AMD Ryzen 9 8940HX
You are gamer first type user, mainly if the titles like CS2, Valorant, or Starfield are coming in your daily rotation. The Zen 4 architecture is having 64MB of L3 cache inside, and this big-size cache is giving one measurable, real FPS advantage in those cache-hungry games, where Intel is simply not able to match it. Also you are wanting capable laptop but without spending too much money on it, and you are preferring to put that saved ₹40,000 to ₹80,000 amount into one better GPU, or into one higher-refresh display, or maybe into a good peripheral setup also.
Which CPU is Having Better NPU for the AI Workloads?
Intel’s AI Boost NPU is delivering 13 TOPS performance, which is coming higher than AMD’s XDNA NPU. Intel is also having one stronger Copilot+ PC ecosystem support as of the mid-2026 time. Saying all this, the real-world NPU utilization is still being one limited thing only. Most of the AI-heavy tasks (like Stable Diffusion, LLM inference work) are still doing offloading to your discrete GPU, which is being significantly more powerful than either of these NPU.